Ever wondered what the unique sound of your name looks like? In this hands-on workshop, we’ll embark on an exciting journey to capture your “sonic signature” and translate it into a striking visual landscape. We’ll begin by generating the audio waveform of your name using text-to-speech. We’ll then delve into audio analysis, extracting meaningful data from the audio output. This data will form the foundation for our visualization.
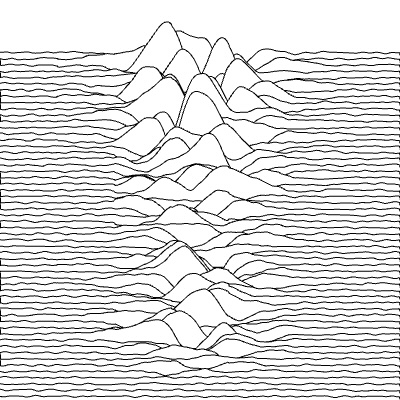
Next, we’ll explore data visualization, learning how to sculpt this processed audio data into a compelling visual representation inspired by the iconic and stark aesthetic of Joy Division’s album artwork. By the end of this exercise, participants will have the opportunity to plot their visual representation, and take home as a physical artwork.
- Understand the fundamental principles of audio sonification and how sound can be represented as quantifiable data.
- Learn how to use JavaScript and the Web Audio API to access and process audio data.
- Learn how to use HTML Canvas and SVG javsascript APIs for data visualization.
- Learn practical techniques for visualizing data in a distinctive and aesthetically driven style, specifically drawing inspiration from the visual language of Joy Division.
- Gain hands-on experience in preparing data visualizations (from Canvas and/or SVG) for physical output using a plotter and understand the process of translating digital visualizations into tangible art.
This workshop is designed for anyone with a curiosity about the intersection of sound, data, artistic expression, and web technologies. It is particularly relevant for:
- Data enthusiasts and individuals curious about data visualization techniques and audio analysis.
- Artists and designers seeking to explore new digital mediums and data-driven art forms using web technologies, including physical plotting.
- Web developers and JavaScript enthusiasts interested in exploring the capabilities of the Web Audio API and visualization libraries for creative applications.
- Individuals interested in the relationship between sound, visual culture, and iconic design aesthetics like that of Joy Division.
- Anyone looking for a unique and hands-on introduction to data visualization, web-based audio processing, and the exciting possibilities of physical plotting.
No prior experience in Javascript development is strictly necessary, though a basic understanding will be beneficial. I will guide you through each step, from processing audio data to applying stylistic transformations that evoke the powerful simplicity of Joy Division’s visuals, and exporting your creation for plotting.
This workshop offers a creative and accessible entry point into data visualization and audio processing, demonstrating how abstract data derived from sound can be transformed into personal and visually resonant forms. You’ll gain practical skills in applying artistic principles to data representation, culminating in the creation of a personalized artwork that beautifully bridges the realms of sound and sight, and is ready for physical manifestation via a plotter.
This workshop will be approximately 3 hours in total.
- Audio Processing and Data Extraction: ~1 hour (Hands-on)
- Data Visualization and Stylistic Transformation: ~1 hour (Hands-on)
- Physical Plotting: ~1 hour (Plotting will happen one at a time.
Participants can continue refining their creations or engage in discussions during this period.)
- Systems/Laptop Specifications: Any laptop capable of running the latest Chrome browser without any lag.
- Software to Pre-install: Preferably the latest Chrome browser. Although most modern browsers are up-to-date with the necessary APIs.
- Any Other Necessary Equipment: If participants wish to record their voice instead of using text-to-speech, a pair of headphones with an in-built microphone is recommended for audio recording.
- Will templates/starter code be provided?
A step-by-step breakdown of the code will be provided to help participants catch up if they encounter any issues implementing.
- What if text-to-speech encounters issues?
Participants can use their own voice and record audio via built-in microphone on their machines.
- What if plotting doesn’t go as planned?
If takes longer than expected to do the plots, local participants’ plots can be completed later and delivered (e.g., via Dunzo). In the worst-case scenario where the plotter is non-functional, artworks can be printed using a regular printer.
- Whether participants will work individually or pairs/groups?
Participants based on their preference / background and proficiency in JavaScript are free to pair programme with other fellow participants.
- Whether any pre-workshop materials or readings will be shared?
A day prior to the workshop I will be sharing a one-pager to help participants set up P5 js accounts to save workshop time. It will also provide general tips for JavaScript programming.
- Post-workshop support or resources (if any)?
I will share a GitHub repository containing the workshop code with all participants for future reference.
- Any assessment methods to ensure workshop outcomes are met by the participants?
As the focus is on creative exploration, all outcomes are welcomed!
Samarth is a creative coder and web developer based in Chandigarh, India, where he works as a front-end developer at Postman. Driven by a fascination for generative design, Samarth has spent the last 10 years building interactive web experiences. Beyond his professional work, he delves into procedural artwork, often materializing his digital visions through plotting and 3D printing. He explores the intersection of code and aesthetics, using Javascript and other tools to create unique visual outputs.


{{ gettext('Login to leave a comment') }}
{{ gettext('Post a comment…') }}{{ errorMsg }}
{{ gettext('No comments posted yet') }}