

VizChitra 2025: India's first community-driven Data Visualization conference
A space to connect and create with data
A space to connect and create with data
Kadambari
Submitted Apr 3, 2025
This talk will explain the process and oucomes behind two information design projects centered around the themes of grasslands and rivers of Bangalore respectively. While the first project will showcase more traditional mapping and data visualization, the second is an exploration in community engagement and Counter Mapping.
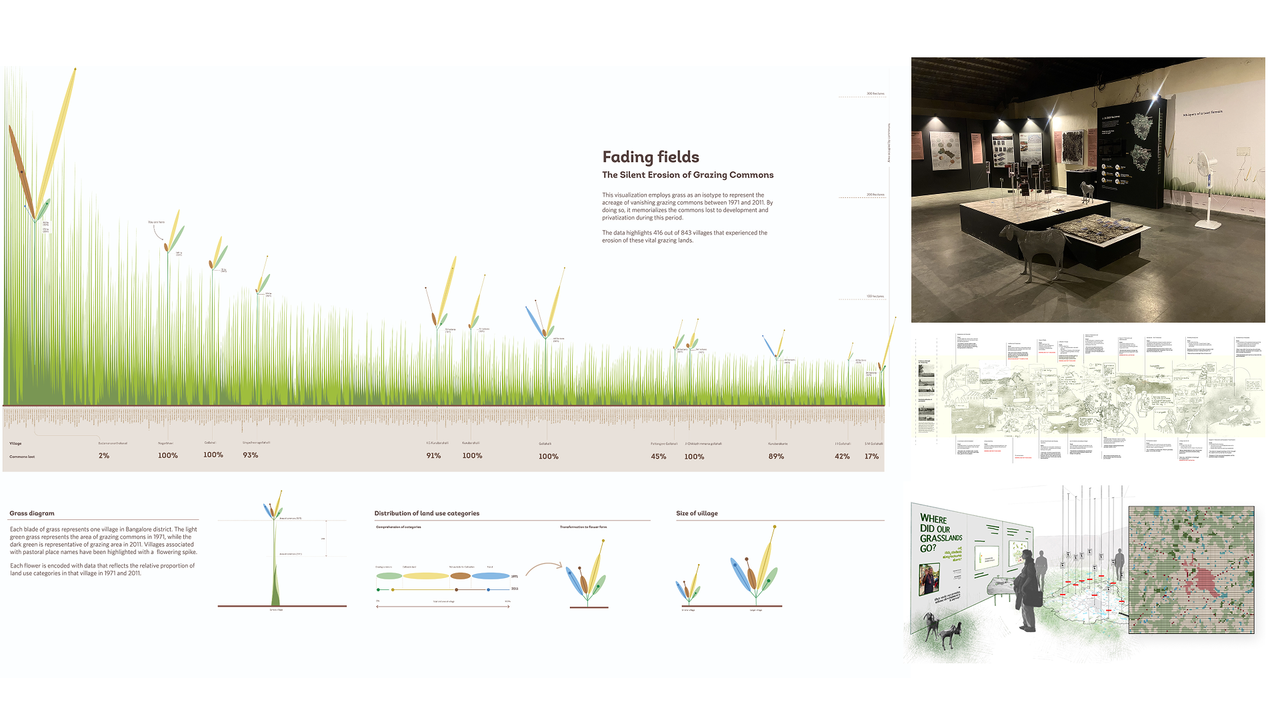
Part 1: “Grasslands of Bangalore” was commisioned by Centre for Pastoralism for their Living Lightly exhibition (Feb 2025). Here, we explored various data sources and evidences to tell the story of the grassland landscapes of Bangalore, ranging from census data sets to archival maps.
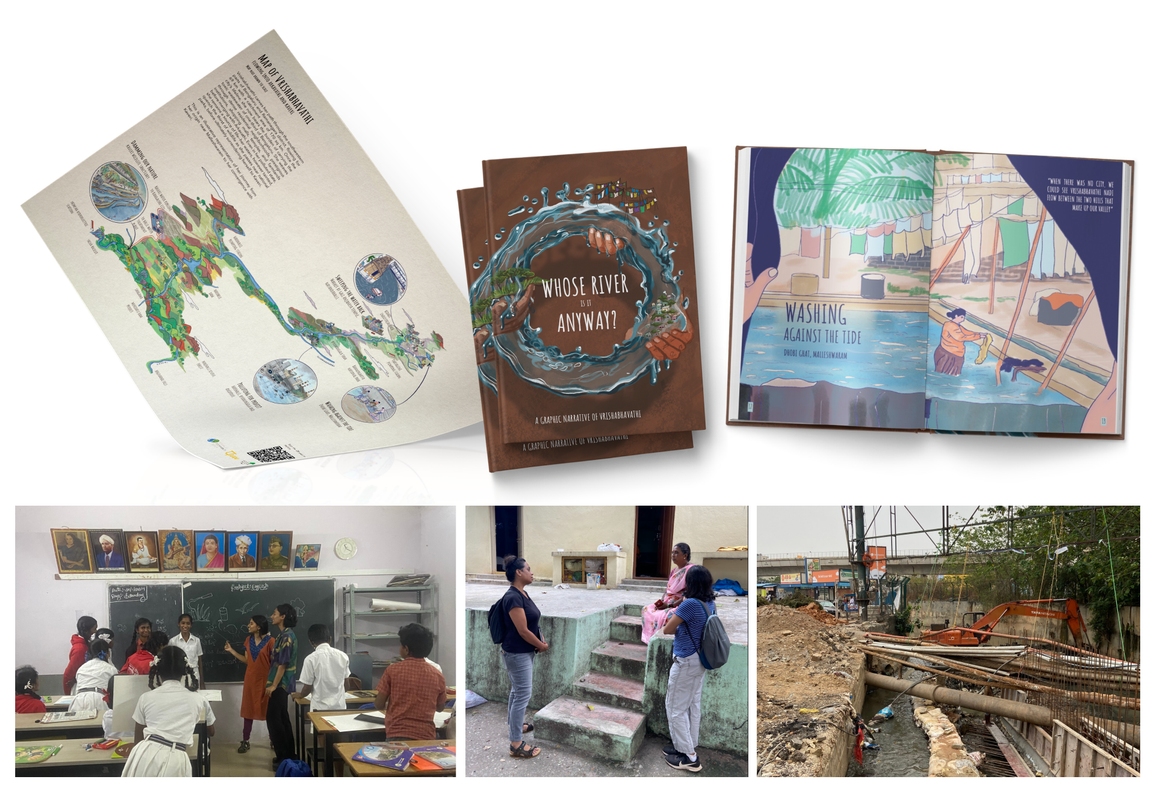
Part 2: “Whose River is it anyway?” is an experiment in Counter Mapping the Vrishabhavathi river in Bangalore, in collaboration with Paani Earth foundation. Through this project, we engaged with communities along the river to build a representative map and narrative.
Supported by Bangalore Sustainability Forum, the project resulted in a graphic book that explored the river through the leses of livelihood, flooding, biodiversity and pollution. This project has been previously presented in Bangalore Design Week and was also published recently in the Hindu. It was exhibited in the Rivers of Life exhibition at Azim premji Foundation (2023) and will be exhibited again at Vishveshwarayya Museum from April 22nd - June 22nd, 2025.
Project website - https://whoseriverisitanyway.framer.website/
Hindu article - https://www.thehindu.com/news/cities/bangalore/a-book-that-delves-into-the-collective-memories-lived-experiences-and-imaginations-of-the-people-who-live-along-the-vrishabhavathi/article69395699.ece
FOCUS AREAS
In this talk, we will focus on the following:
Processes:
Using design, data visualization and illustration as tools to build emotionally compelling stories on the landscapes of Bangalore
Challenges:
Anyone interested in Mapping, Visualization, Collaborative narratives and the Landscapes of Bangalore will find this presentation rewarding
PRESENTERS
This talk will be conducted by Kadambari Komandur, Namrata Narendra and Chinmay Pathak
Kadambari is an information designer from NID Bangalore with an interest in landscapes and ecology and training in the study of built landscpes. She is a UX designer by day and a researcher, data visualizer and explorer otherwise. She is currently engaged in projects examining the relationships between communities and urban landscapes. With a belief in using design as a tool for critical thinking and social justice, she imbibes this thought process in her work.
Namrata is an urban researcher based in India and the Netherlands working on her PhD on questions of peri-urban water provisioning with a focus on environment, infrastructure and governance. Having been trained in designing and developing built landscapes, her research and practice is rooted in understanding the relationship we share with them and the socio-ecological impacts these structures have beyond the urban spaces we inhabit. This project amongst others is her attempt to understand Bengaluru’s water journey, especially the conditions of urban rivers, social and spatial injustice and challenges caused by fragmented urbanisation.
Chinmay is an Information Designer from NID Bangalore. Having worked in IIHS Bangalore and Reuters, he specializes in data narratives and data cartography to address multifaceted social, cultural, and environmental challenges. He firmly believes in the transformative potential of design thinking, particularly in navigating intricate scenarios.
Hosted by
Supported by
Platinum sponsor
Gold Sponsor
Bronze Sponsor
Media Partner


{{ gettext('Login to leave a comment') }}
{{ gettext('Post a comment…') }}{{ errorMsg }}
{{ gettext('No comments posted yet') }}